With an YTD gain of 22.1% through yesterday, the S&P 500 is on pace for its second annual 20% gain in a row. Surprisingly, that has only happened two other times: first, three times in a row from 1954-56, and second, four years in a row from 1995-98. However, the average S&P 500 member has returned only 17.0% YTD, more in line with the equal-weighted S&P 500.
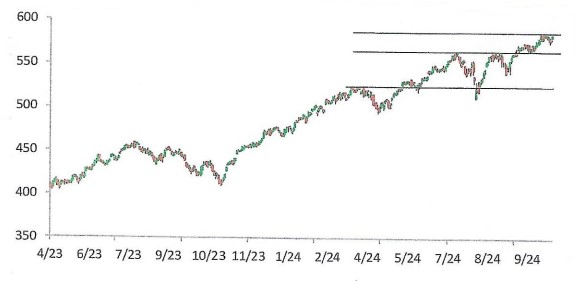
From a technical perspective, support levels have been tested multiple times over the last few months and have generally held up well as shown below:
S&P 500 ETF (SPY): LAST 18 MONTHS

Source: Bespoke Investment Group
Stocks continue to climb a “wall of worry.” It is typical that the bears emphasize “bad” news along with market warning signs – that seems to always be the case. But the current bull market has an excellent foundation: strong earnings growth, easing monetary policy, solid breadth, and a powerful theme: artificial intelligence. The bull market remains intact.
The following quote on investing is from one of our investment heroes, Howard Marks from Oaktree Capital: “The bottom line on the quest for superior investment returns is clear: You shouldn’t expect to make money without bearing risk, but you shouldn’t expect to make money just for taking risk. You have to sacrifice certainty, but it has to be done skillfully and intelligently, and with emotion under control.”
Coming into this earnings season, analyst sentiment was weak as more companies in the S&P 1500 had seen downside revisions to EPS estimates than upward revisions in the prior month. The silver lining is that this sets the bar low for companies as they report. As we move into the heart of earnings season, 69% of companies reporting have beaten consensus EPS estimates, but only 56% have beaten consensus sales estimates (far weaker than normal). In terms of guidance, only 6% have raised guidance compared to 9% that have lowered. About three-quarters of AI stocks have yet to report. Keep in mind earnings growth in 2024 is still forecast at 9.8%.
Like recent quarters, stock price reactions have been severe for those companies missing estimates or giving poor guidance. Investors are not tolerant of companies that disappoint. It is truly a market of individual stocks and their earnings.
ELECTION 2024
The Real Clear Politics (RCP) national average of polling moved to a dead heat last Friday. The fact that Trump is tied with Harris nationally in the RCP Average is certainly a better position for Trump to be in versus where he was in 2020 and 2016, but this is still a close race and no one knows what the outcome will be.
Betting markets show something different. They give Trump odds of roughly 60% to win the election versus 39% for Harris (electionbettingodds.com). The betting markets generally have a good track record but can be wildly off the mark at times. At this point in 2016, Clinton was ahead of Trump 80% to 20%.
We are not making investment decisions related to this election. History shows market consequences of a certain candidate’s victory are unpredictable. For example, when Trump was elected in 2016, expectations were that technology would underperform, and financials and energy would outperform. The exact opposite was true.
