The Q2 earnings season is about over. The big story has been the selling we have seen of stocks after they report. The average stock has fallen 0.71% on its earnings reaction day, the worst in 10 years.
The reports themselves were quite good. Entering earnings season the projection for the quarter was for S&P 500 earnings to fall 7.2%. The final number is about a 5.2% decline (source: FactSet). Sixty-nine percent of companies beat consensus analyst EPS estimates while 62% beat sales estimates. An equal percentage of companies raised or lowered guidance (10%). Now that earnings season is over, stocks will have to react to other news.
The jump in the year-over-year July CPI reading was due to base effects as some of the worst readings from spring of last year rolled off the tally. With the year-over-year CPI rising in July, it ended a streak of 12 monthly declines, the longest streak of monthly year-over-year declines on record dating back to 1930. Not until early 2024 will year-over-year rates begin falling again if we manage to stay in the 0.1% – 0.2% range on a month-over-month basis.
Fed Chair Powell believes consumer inflation expectations are a leading indicator for actual inflation, and he wants to see expectations stable and ideally trending down towards 2%. The current consumers’ one-year forward inflation expectations have dropped to 3.3% year-over-year. What is notable about the 3.3% number is that it is below the 45-year average reading of 3.6%, and well below last year’s 5% expectation. This is a good number for investors hoping for an end to the Fed’s tightening cycle.
However, the ‘CPI Nowcast’ model run by the Cleveland Fed is projecting a month-over-month increase of 0.77% for the headline August CPI release! The jump can be attributed to the sharp increases lately in oil and gasoline. Powell’s focus will be put to the test if the August reading comes in anywhere near 0.77%. It is a white hot number that will make headlines. We think the forecast August number by the Cleveland Fed is too high because of dramatically falling rents. The markets are currently projecting an 11% chance of a September rate hike which we think is too low.
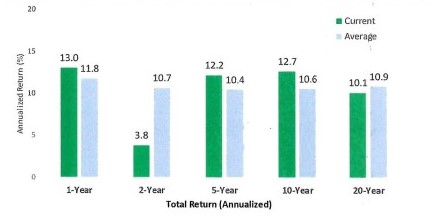
We recently took a look at historical market performance with a long-term perspective. As shown in the chart below, the annualized returns of the S&P 500 over the last one, five, and ten years are only modestly above their long-term averages while two-year and twenty-year returns are below their historical average. Does this look like a market that is unanchored from reality as the bears claim? Not at all, in our view.
S&P 500 Current vs Average Total Returns 1928-2023

Source: Bespoke Investment Group
And performance of the Treasury market has been disappointing. If you have owned a 10-year Treasury for the last five years, even including coupon payments, you have lost money.
WHY DIVIDEND STOCKS ARE SO WEAK
With Treasury yields high, stocks with low-growth characteristics that are more known for their high dividend payouts are massively underperforming this year.
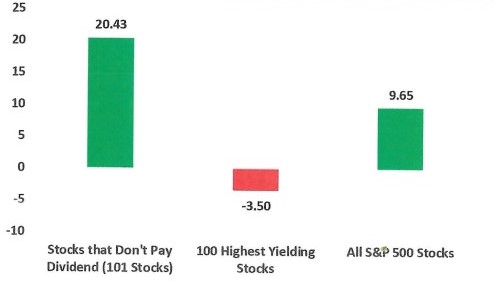
As shown below, the average stock in the S&P 500 is up roughly 10% YTD (a lot lower than the index return of 17% YTD). But the highest dividend payers are down 3.5%, and the 100 stocks in the index that don’t pay dividends are up an average 20.43%, as shown below:
Average Total Return YTD % 2023- a/o 8/11/23

Source: Bespoke Investment Group
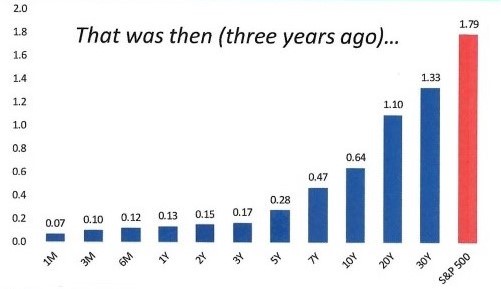
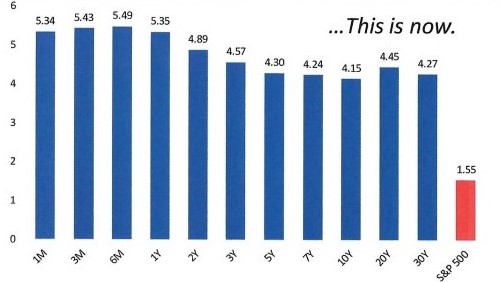
High dividend paying stocks typically provide competitive returns. What has changed is the level of interest rates. Three years ago the dividend yield on the S&P 500 was much higher than Treasury yields. Today the S&P 500 dividend yield is below all Treasury yields. See this reversal in the bar charts below:
Treasury Yields vs. S&P 500 Dividend Yield (8/11/20)

Treasury Yields vs. S&P 500 Dividend Yield (Today)

Source: Bespoke Investment Group
We like dividends as much as other stock investors. We view them as a sweetener to buy, but never the main reason to buy a stock. Dividend yields are only one metric we use of many to analyze the attractiveness of a stock for client portfolios.
