“Unprecedented” feels like an overused word these days, but it is no overstatement when it comes to the oil market. In the March mid-month commentary, we wrote that the oil supply glut could throw another gut punch to our economy on top of the coronavirus. Our worst fears came to pass last week Monday as the price of oil crashed and actually went negative!
Oil traders are storing crude in the expectation that they can get a higher price later, but storage capacity is running out. Traders who are long in the market are having trouble finding storage for delivery, so they have to sell at a firesale price. Oil has since rebounded to positive territory – about $13/barrel for WTI (West Texas Intermediate) June contracts. Higher prices reflect optimism that the global economy will bounce back later this year, and that sufficient demand will return to soak up some of the glut.
The larger problem won’t expire when these short-term contracts do. The American Petroleum Institute estimates that global oil production is still about 100 million barrels a day, but demand has fallen to 70 million barrels. Demand for oil will return when global growth returns, and the sooner, the better.
What all this means for the economy is hundreds of thousands of jobs lost – at exactly the time our economy can’t afford to take another hit. Cap-ex expenditures in the oil patch are plunging and smaller drillers are just trying to survive – many won’t, either through bankruptcy or mergers. Banks are big lenders to the oil industry and will be hit with defaults – especially regional banks in Texas and Oklahoma.
Technology stocks have never been considered “defensive,” but maybe they should be considering how well they are performing during the pandemic. In a society forced to shut down, consumers will flock to the “digital world.”
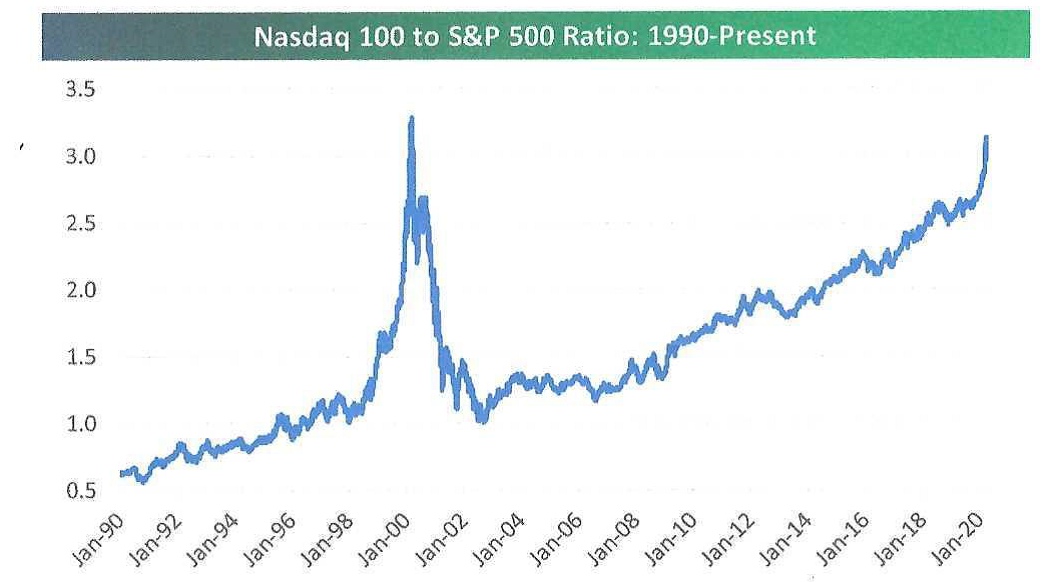
The strong outperformance of the tech-heavy NASDAQ 100 versus the S&P 500 is nothing new. Over the last 17 years the NASDAQ 100 has been on a straight path higher relative to the S&P 500. This ratio is now close to the peak seen at the height of the internet bubble in 2000 (see graph). Back then, the spike in the ratio came as the entire market was soaring. The recent spike came during a broad market crash.

Source: Bespoke Investment Group
Although the long run outperformance of tech concerns us (it won’t last forever), we remain overweighted in tech stocks. In a no-growth world, many tech companies are posting impressive gains in sales, profits and cashflow. Many of the larger tech companies tend not to be heavily indebted and are sitting on piles of cash. The big investment question is in whether they can survive a deep recession. Most can answer: Yes.
Barron’s recent Big Money Poll shows bullish sentiment by institutional investors. About 39% are bullish on stocks in 2020, but a whopping 83% are bullish for 2021. This surprises us seven months ahead of a year with very low visibility. Almost a third of respondents expect the U.S. economy to start growing again in the third quarter, and a half point to the fourth quarter.
The three biggest risks to the U.S. stock market in the next 12 months according to the survey?
Coronavirus pandemic spreads 35%
U.S. recession 24%
U.S. depression 14%
Finally, the poll asked who will win the 2020 Presidential Election:
President Trump 56%
Former VP Biden 39%
THE FEDERAL RESERVE VERSUS VALUATIONS

Two of our most convincing market-drivers are pulling in diametrically opposite directions.
On one hand we have the Federal Reserve. The recent monetary stimulus has been unprecedented, easily outpacing the actions during the financial crisis. Having the Fed add so much liquidity into the system is very encouraging. In the past, smaller Fed moves have been grounds for prolonged rallies in stocks. We believe in the old adage, “Don’t fight the Fed.”
But on the other hand, we have rich valuations – again. At the March 2009 lows, stocks were trading at 8x peak earnings. This time around stocks bottomed at 16.5x peak earnings, about double the 2009 low valuation. The recent rally has brought us back to over 20x peak earnings. From the 2009 lows, it took more than seven years to reach these multiples, first getting to this level in Q4 2016 when there was much less to worry about than today. It was accepted that stocks should trade at the high end of historic valuations.
Looking at just one data point, the September 2016 ISM Services report showed the largest monthly jump in history. That contrasts with this March’s report that showed a decline (the first in years) and the April report is certain to be weak. It is a very different world than it was in late 2016, yet the multiples on earnings potential is the same.
To summarize, P/E multiples are almost as rich as they were just before Covid-19. Yet the personal tragedy and the underlying economic disaster the world is dealing with are unlike anything we have seen since the Great Depression. Unless we see a quick V shaped economic recovery (unlikely), we expect stocks to retreat until we have more clarity on the economic fallout.
