
Are we due for a post-election pop? If history repeats, 2019 may be a very profitable year. Although stock prices typically drop about 3% in the six months prior to a (first term) mid-term election going back to WWII, prices rise on average 19% in the 12 months after the election. A rally has occurred 100% of the time (18 occasions). Let’s make it 19. Source: CFRA and S&P DJ Indexes.
We see signs this bull may continue to run. Although gains in large-cap stocks this year have been modest, it has been a successful year of consolidation thus far. Holding on to your gains after a rewarding year is a satisfying way to go through a ‘time correction’ (that is, waiting for earnings to catch up with share prices). Here are three factors we think could start another leg up:
- No signs of a recession. The U.S. economy is in the ninth year of expansion–the second longest but also one of the shallowest which means there are few excesses. Labor force growth and productivity can absorb expansion without running short of capacity. Second quarter GDP growth was recently announced at 4.1%. We are not ‘overdue’ for a recession. Slowdowns don’t operate on a calendar schedule. Expansions don’t die of old age.
This will likely be the first decade since the 1850s without a recession. Prior to WWII, the average contraction in economic activity was 22%! No wonder they were called panics. Now the average dip is 2.3%. Before WWII the U.S. experienced a recession every 2.5 years on average. Now we see a recession every 5.3 years on average. The bull market should last as long as the economy expands.
- Earnings are flourishing. Second quarter earnings growth is coming in over 20% with the same gains expected for the rest of the year. Tax reform is only partly responsible for this. Ten percent earnings growth is forecast for 2019, another hearty year (Source: FactSet). With higher earnings comes improved cash flow allowing companies to buy back stock, increase dividends, and invest in cap ex for future growth (see our June commentary, ‘Show us the Money’). We were happy to see stocks react to great Q2 earnings.
- Market dynamics are flashing green. The perception by many investors that only the FANG stocks (Facebook, Amazon, Netflix, and Google) are rising and the rest of the market is languishing is incorrect. True, the S&P 500 is flat without the performance of the FANG stocks, but many growth stocks are firmly positive this year while value stocks lag. In fact, the Russell growth index is up 12% this year while the Russell value index is barely in the black. In addition, many small and mid-size stocks are outperforming their large-cap peers. The bottom line is that market breadth is improving. And many investors are flush with cash. Mutual fund managers have almost 5% in cash in portfolios, and private equity firms have $1.1 trillion in cash to spend which should help valuations on public securities, too.
Of course, the market always has warts. Here are three of them with an argument on why they might not thwart a second-half rally:
- Valuations remain above average. Higher valuations are warranted by low interest rates, higher profit margins, and fewer stocks to invest in (reduced supply), but saying this time is different is always dangerous. Twelve month forward P/Es have come down markedly since January and now stand at a more reasonable 16.5x.
- The Fed is in tightening mode. At its current pace, the Fed funds rate should hit 3.0%-3.25% by the end of 2019, up from 1.75% to 2% currently. The yield curve could invert, but stocks have historically rallied 7% after an inversion (Source: Drach Market Research). Still, a policy mistake could prematurely end the expansion.
The trade spat may turn into a trade war. A protracted trade dispute would expose the American people to economic (slower growth with higher inflation) and investment market blowback. Is President Trump’s approach politically driven (for short-term negotiations) or policy driven (a longer timeframe designed to reset a global imbalance or gain strategic advantage)? There is no clear answer at this time.
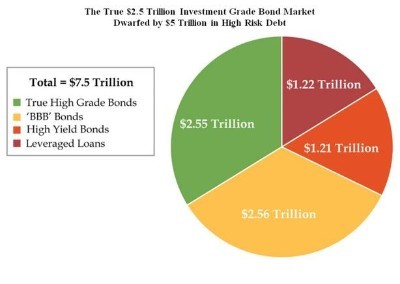
Investors Should Question Overzealous Debt Creation
Global debt among corporations, households, and governments now represent 318% of worldwide GDP (or $247 Trillion). The pace of debt creation over the past few decades has been unrivaled with the possible exception of the two world wars. Rising debt levels ultimately become dangerous as they consume ever greater percentages of revenues, earnings, and taxes while leaving little for consumption or investment. Ultimately, debt diminishes growth and encourages economic stagnation and or deflation.
Combined with the nascent unwind of the uber-accommodative central bank monetary policy across developed world economies, professional bond investors are now re-evaluating their bond portfolio holdings. Given time, the bond vigilantes will rise up and force the market to reflect these rising risks through greater spread premiums. Bond losses, the result of increasing risk premiums are sure to make investors anxious leading to still more forced liquidation in the high yield and leveraged loan markets.
It is clear that the recent souring of emerging market debt sentiment has caused a rapidly accelerating liquidation of dollar-denominated EM debt. We believe the concern is warranted and that contagion could soon spread to the high yield (Junk) market and conceivably beyond to other risk assets including leveraged loans, “BBB” grade bonds or even stocks.
Source: Bloomberg & Quill Intelligence
Debt Percentages and Definitions:
High Grade Bonds (34%) – Higher rated, in terms of credit quality as judged by the ratings agencies, investment grade bonds are made up of those issuers most likely to repay both interest and principal obligations.
“BBB” Investment Grade Bonds (34%) – These are bonds issued by more credit challenged, or borderline non-investment grade, entities making them more vulnerable to the vagaries of the economic cycles and rising rates.
High Yield Bonds (16%) –Often referred to ask “junk,” these bonds offer additional yield (that increase as credit quality diminishes) along with significantly heightened default or nonpayment risk.
Leveraged Loans (16%) – Commercial loans, often pooled when purchased by individual investors, provided to below investment grade borrowers. These loans can be secured with a lien on each company’s assets and are often senior to other outstanding debt.
Chart Observations:
Over half of all investment grade bonds are now at the bottom credit rating rung of “BBB.” Many investors, especially professionals, would be compelled to sell their debt holdings if the bonds were downgraded to nearby “junk” territory.
Borderline non-investment grade bonds along with high yield and leveraged loans now account for two-thirds of all outstanding issuance meaning fixed income investments are now primarily “risk” assets. None of these bond categories makes sense for widows, orphans or even individual investors except as a part of a larger, more diversified (and professionally managed) fund investment.
Clearly the corporate bond market has grown more vulnerable to market events. All high yield bonds and leveraged loans may become pigeonholed as poor investments in a more challenged economy. Further, rising rates may push anxious investors to the exits all at once placing extreme pressure on ETFs and other passively managed bond funds.
Investors should now question overzealous debt creation. Given recent credit deterioration, greater caution should be exercised when investing in all bonds much less the more risky sectors. We remain convinced that lesser quality debt and the losses that will result from these holdings pose a significant risk to unwary investors.